

J05D
Fort Rock, OR, USA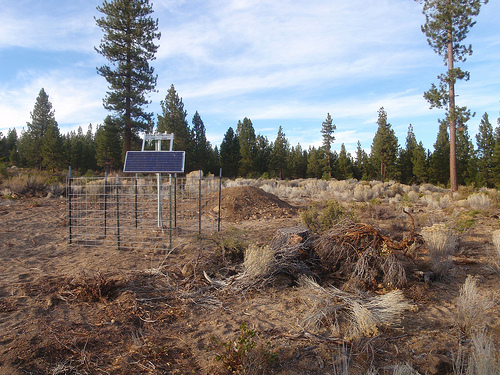
The USArray component of the NSF-funded EarthScope project ended its observational period in September 2021 and all remaining close-out tasks concluded in March 2022. Hundreds of seismic stations were transferred to other operators and continue to collect scientific observations. This USArray.org website is now in an archival state and will no longer be updated. To learn more about this project and the science it continues to enable, please view publications here: http://usarray.org/researchers/pubs and citations of the Transportable Array network DOI 10.7914/SN/TA.
To further advance geophysics support for the geophysics community, UNAVCO and IRIS are merging. The merged organization will be called EarthScope Consortium. As our science becomes more convergent, there is benefit to examining how we can support research and education as a single organization to conduct and advance cutting-edge geophysics. See our Joining Forces website for more information. The site earthscope.org will soon host the new EarthScope Consortium website.

By Maia ten Brink
Vladik Martynov is eavesdropping on North America. From his computer in San Diego, he gets real-time updates of what’s going on at the ground—and underground—from a dense grid of seismometers stationed across the United States called the USArray Transportable Array (TA). Sound waves registered on TA seismometers can tell him if earthquakes happen, where mining blasts occur, when storms thunder overhead, or whether a train passed near a seismic station.
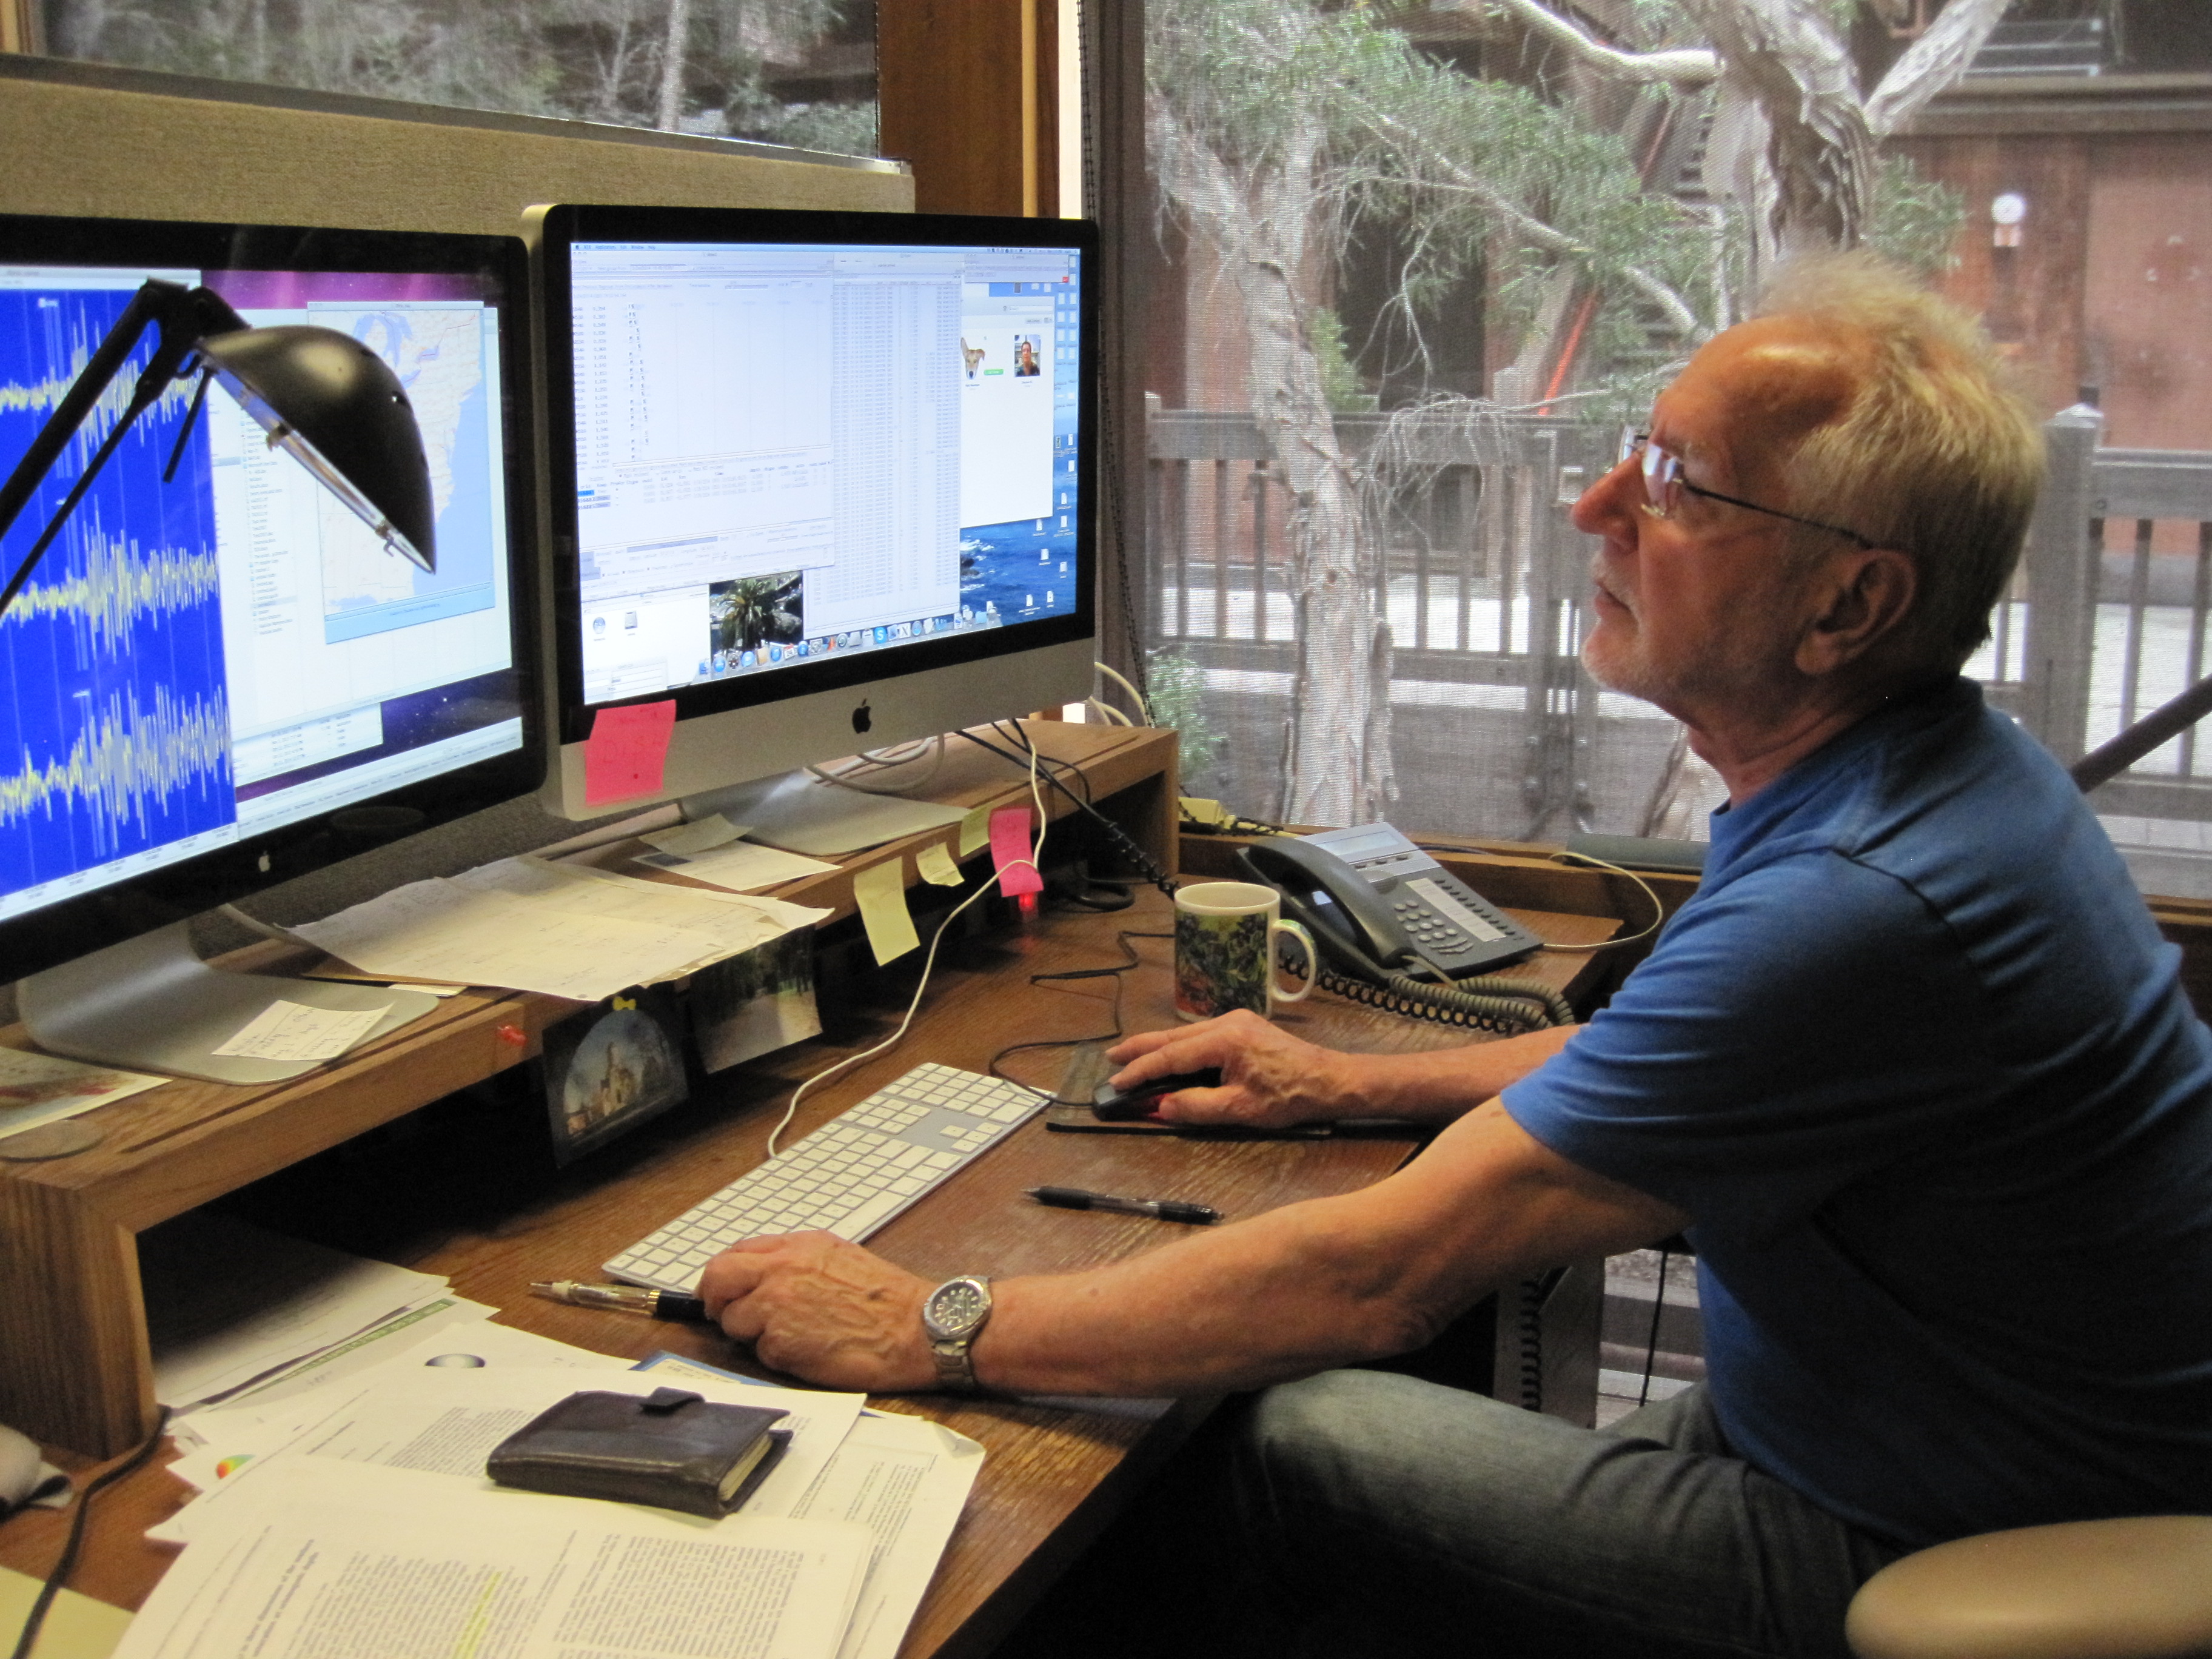
Vladik Martynov at his desk at the Array Network Facility
Martynov is a senior analyst at the Array Network Facility (ANF) at the University of California at San Diego. He speaks in a Russian accent rich with consonants and thoughtful pauses. By the edge of the Pacific Ocean, Martynov sits at his computer in a dim office making “phase picks,” also known as “picking.” His eyes flick over yellow seismic waveforms on a vivid blue background, assessing incoming seismograms. He scans all 400+ stations for correlated activity, then picks what he determines are the beginnings of P-waves and S-waves. He decides which types of waves they are based on their velocities, their shapes, and their arrival on the seismogram’s vertical and horizontal channels.
He enters that information about the timing of incoming seismic waves into a program that accounts for the dynamics of Earth’s crust in order to calculate the coordinates, locations, and depths of earthquakes. Martynov’s pickings are essentially surface observations that allow him to infer backward about what happened underground.
Martynov has a reputation at the ANF as a processing wizard. “Vladik is a machine,” says Jon Tytell, a fellow analyst. “He loves processing earthquakes in realtime. I think it is kind of a puzzle-solving daily thing for him.”
Most days, he arrives at the office at 7:30 AM and spends the first two or three hours of his day processing seismic recordings from the previous 12 hours. Then he begins to process events as they pop up, in “quasi-real time,” with a delay of about half an hour. He checks the results of the automatic detector’s pickings, tweaks them, adds new phase picks, cleans up data, and calculates earthquakes’ locations.
The job requires a keen sense of geological context. For example, earthquakes in Japan have produced different waveforms as the TA stations that record them have rolled from west to east across the United States. The shapes of waveforms also depend on local geography. For instance, waveforms from a station a valley or a basin will resonate, so Martynov will check satellite images to confirm that the station does indeed sit in a sedimentary basin, and the ringing is not an erroneous signal. It is not so much frustrating as a great challenge that the network is so dynamic.
“I like to process good teleseismic [i.e. extremely far-off] events with good, sharp phases you can see clearly,” says Martynov. Those seismograms look like textbook examples. He dislikes earthquakes from Mexico’s Baja Peninsula; “they have very weak P-wave arrivals. It is just so difficult to get good results of picking.”
He averages around 30,000 picks per week. “He does the work of probably five people,” says an old colleague, Rob Newman. “He’s just incredible; he has his eyes on all the data and an ability to pick out large and small events that other people wouldn’t notice.”
Although Martynov runs the data through a computer program called a detector that makes automated phase picks, it is no substitute for vigilant eyes and experience. To ensure accuracy, he checks the detector’s picks, then checks his own picks a week later with fresh eyes. He has developed a finely tuned sense of what looks right, like a radiologist examining an x-ray. He diagnoses the frenzy and lull of North America’s rhythms.
In the 1980’s, Martynov was a researcher at the Institute of Physics of the Earth in Moscow. He was working on an expedition in the Pamir Mountains of Central Asia with a group of American geophysicists that included ANF director Frank Vernon. When the Soviet Union collapsed, Martynov continued to collaborate with Vernon’s research group in San Diego. “Step by step I decided that I could do nothing in Russia and it is interesting for me to work here and I could work with very good, high-quality digital data,” says Martynov.
Now his main responsibility is analyzing and quality-controlling the TA data set. It is no small feat. In the last decade, the ANF has logged and processed over 18 terabytes of data from nearly 2000 TA stations. Martynov and the other ANF analysts have picked over 6.7 million wave arrivals for more than 78,000 events. Eleven thousand four hundred of those events were earthquakes with a magnitude of 5.0 or greater.
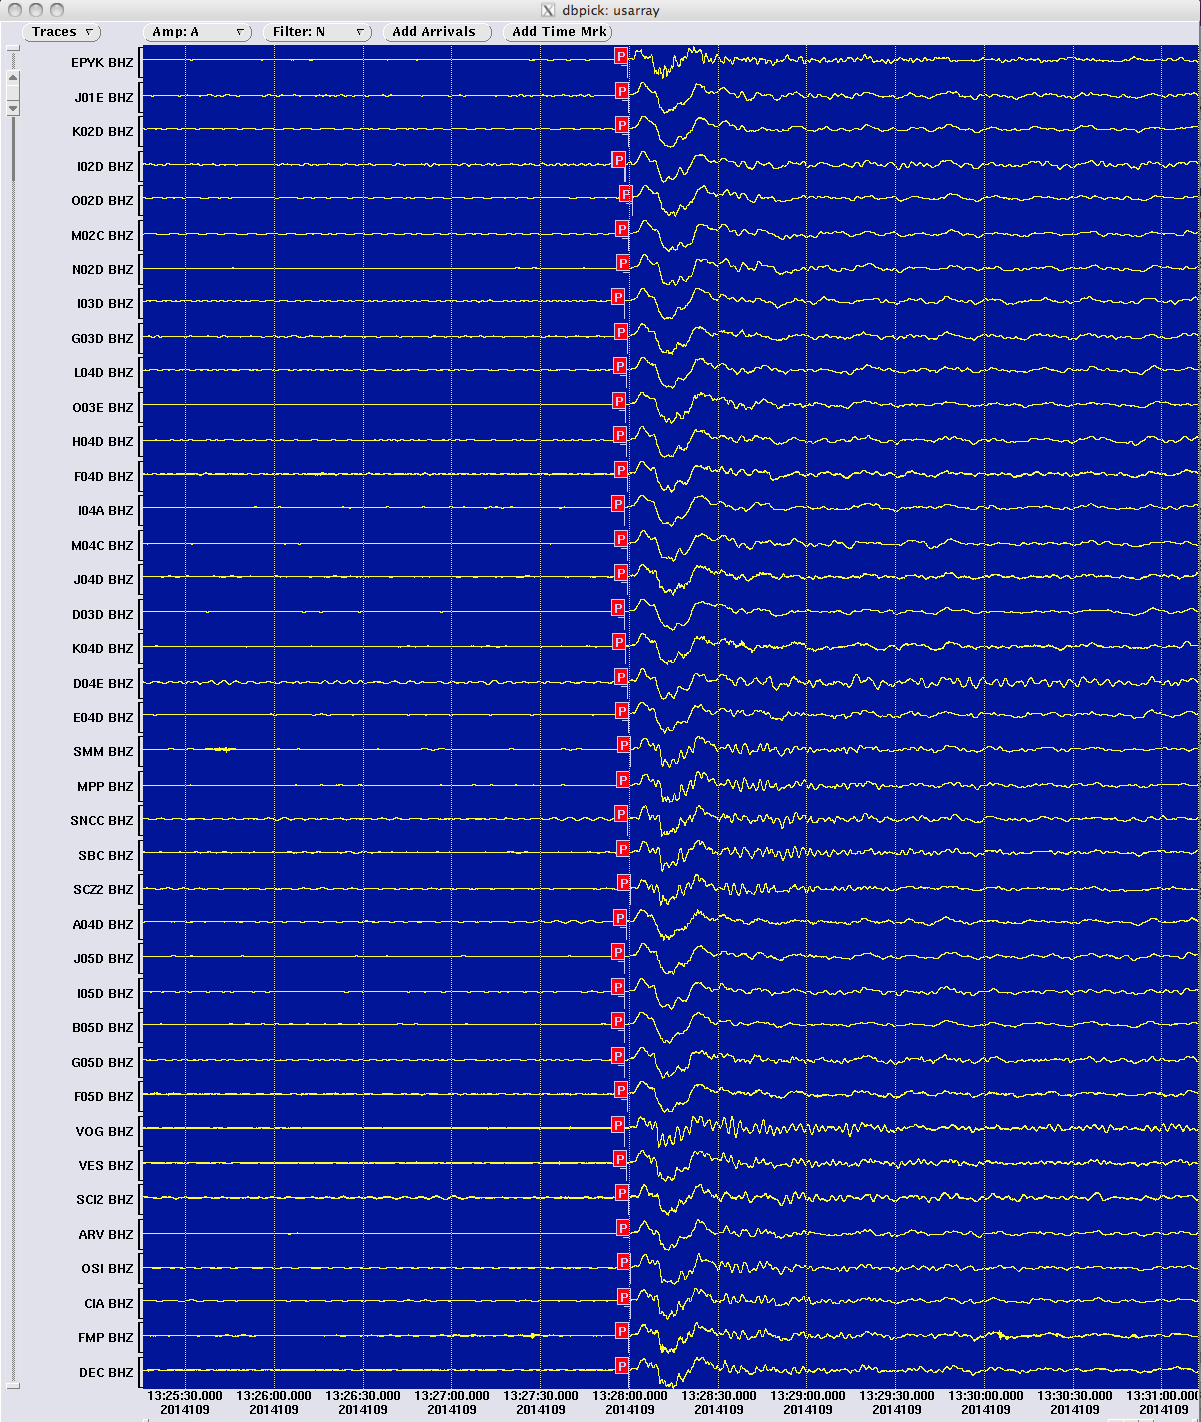
Screenshot from Vladik’s computer of a magnitude 7.5
earthquake that occurred on April 19, 2014, in the Solomon Islands.
The figure shows the waveforms across most or all of the
Transportable
Array stations, which are along the vertical axis; time is the y-axis.
Aside from earthquakes, the second most common sounds recorded in the United States are mining explosions. Since the TA seismometers are currently stationed on the East Coast, Martynov has been observing lots of quarry blasts in the late afternoon. He points to a squiggle on the seismic trace. “It’s near the end of the working day, and during this part of the working day is when explosions will usually happen. The distance is about 40 kilometers from the closest stations, and about 200 kilometers from the farthest stations [that registered the blast].” With large events, Martynov sees the vibration ripple beneath dozens of adjacent stations.
There are certain telltale signatures Martynov can read on the seismograms. “Sometimes it is easy to recognize, is it a [mining] blast or an earthquake?” he says. “Some blasts have very intensive surface waves, poor P-waves, and weak S-waves. When you see these recordings, you are absolutely sure it is a blast. What does it mean? That it was a bad-quality blast because seismograms from a good explosion are difficult to discriminate from earthquakes.”
TA’s seismic stations are so sensitive that they can pick up noise from ocean surf, cars, running water, and storms. Vibrations from highways and heavy farm equipment show up as high-frequency sound waves of 8–10 Hertz. Martynov can also see human-generated seismic noise shift exactly one hour during Daylight Savings.
Errors in the seismograms look like flatlined waves, rectangular boxes, or spikes. Martynov notifies other members of the ANF’s team, who figure out the root of the problem. They can solve some malfunctions by remotely recalibrating seismometers or resetting computers, but other times they have to send a service person out in the field to fix a sickly station.
Martynov enters every pick into the ANF’s official bulletin of seismic events, whether it was a natural or human-generated sound. Why? For one thing, there’s not enough time to agonize over every pick. “We have just two guys, me and Malcolm,” says Martynov. “We have to be fast fast fast fast fast. Sometimes you don’t have time to think. It’s rote.” He also wants to avoid biasing the analysis by throwing out so-called unimportant sounds. Scientists around the world reference the ANF seismic bulletin to corroborate with other seismic networks, access TA data, or run analyses of their own. The goal is to make the full spectrum of raw and processed data freely available so that others can use it in ways that haven’t even been imagined yet.
The TA has set a new standard for data collection and quality control, despite having to manage such massive amounts of data. Their data return rates soar at 98%. With Martynov’s eyes combing the seismograms, the TA team can fix errors quickly and ensure highly accurate picks.
“I am feeling proud not for myself, but about our team,” says Martynov. “We have a small team and you see how much we are doing.”
The fruits of their labors are just beginning to ripen. Scientists are just now combing through TA data and recordings. As they listen, they will be able to hear the sounds and secrets of deep Earth.
Additional information about seismic waves and how seismometers work:
http://www.iris.edu/hq/programs/education_and_outreach/animations/9
http://www.iris.edu/hq/programs/education_and_outreach/animations/8

