

G03D
McMinnville, OR, USA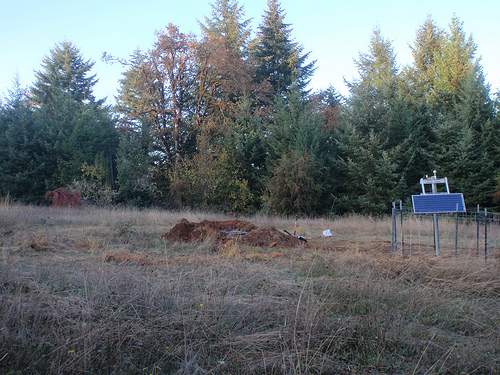
The USArray component of the NSF-funded EarthScope project ended its observational period in September 2021 and all remaining close-out tasks concluded in March 2022. Hundreds of seismic stations were transferred to other operators and continue to collect scientific observations. This USArray.org website is now in an archival state and will no longer be updated. To learn more about this project and the science it continues to enable, please view publications here: http://usarray.org/researchers/pubs and citations of the Transportable Array network DOI 10.7914/SN/TA.
To further advance geophysics support for the geophysics community, UNAVCO and IRIS are merging. The merged organization will be called EarthScope Consortium. As our science becomes more convergent, there is benefit to examining how we can support research and education as a single organization to conduct and advance cutting-edge geophysics. See our Joining Forces website for more information. The site earthscope.org will soon host the new EarthScope Consortium website.

By Maia ten Brink
Before microscopes, we had no idea that the human body was teeming with microbes. Before telescopes, we could only wonder how stars formed. Sometimes, it takes the right scientific instrument to see old questions from new angles and spark new advances in research.
The USArray Transportable Array (TA) is a grid of more than 400 seismometers spaced every 70 kilometers. For the last ten years, the TA has marched slowly across North America measuring seismic waves from Earth’s vibrations. The TA acts as a kind of microscope and telescope—an “EarthScope”—to observe what goes on right beneath our feet.
Because the TA is the densest, most extensive seismic array of its kind, researchers have been able to zoom in and out to see patterns and features they might have missed with a smaller or sparser seismic network. Combing through a decade of TA data, analysts at the Array Network Facility (ANF) at the University of California, San Diego, have been able to provide more details on three phenomena: microseismicity, seismic waves generated by meteorological events, and seismic noise.
An Earthquake Up Close
Luciana Astiz, the associate director of the ANF, has seen
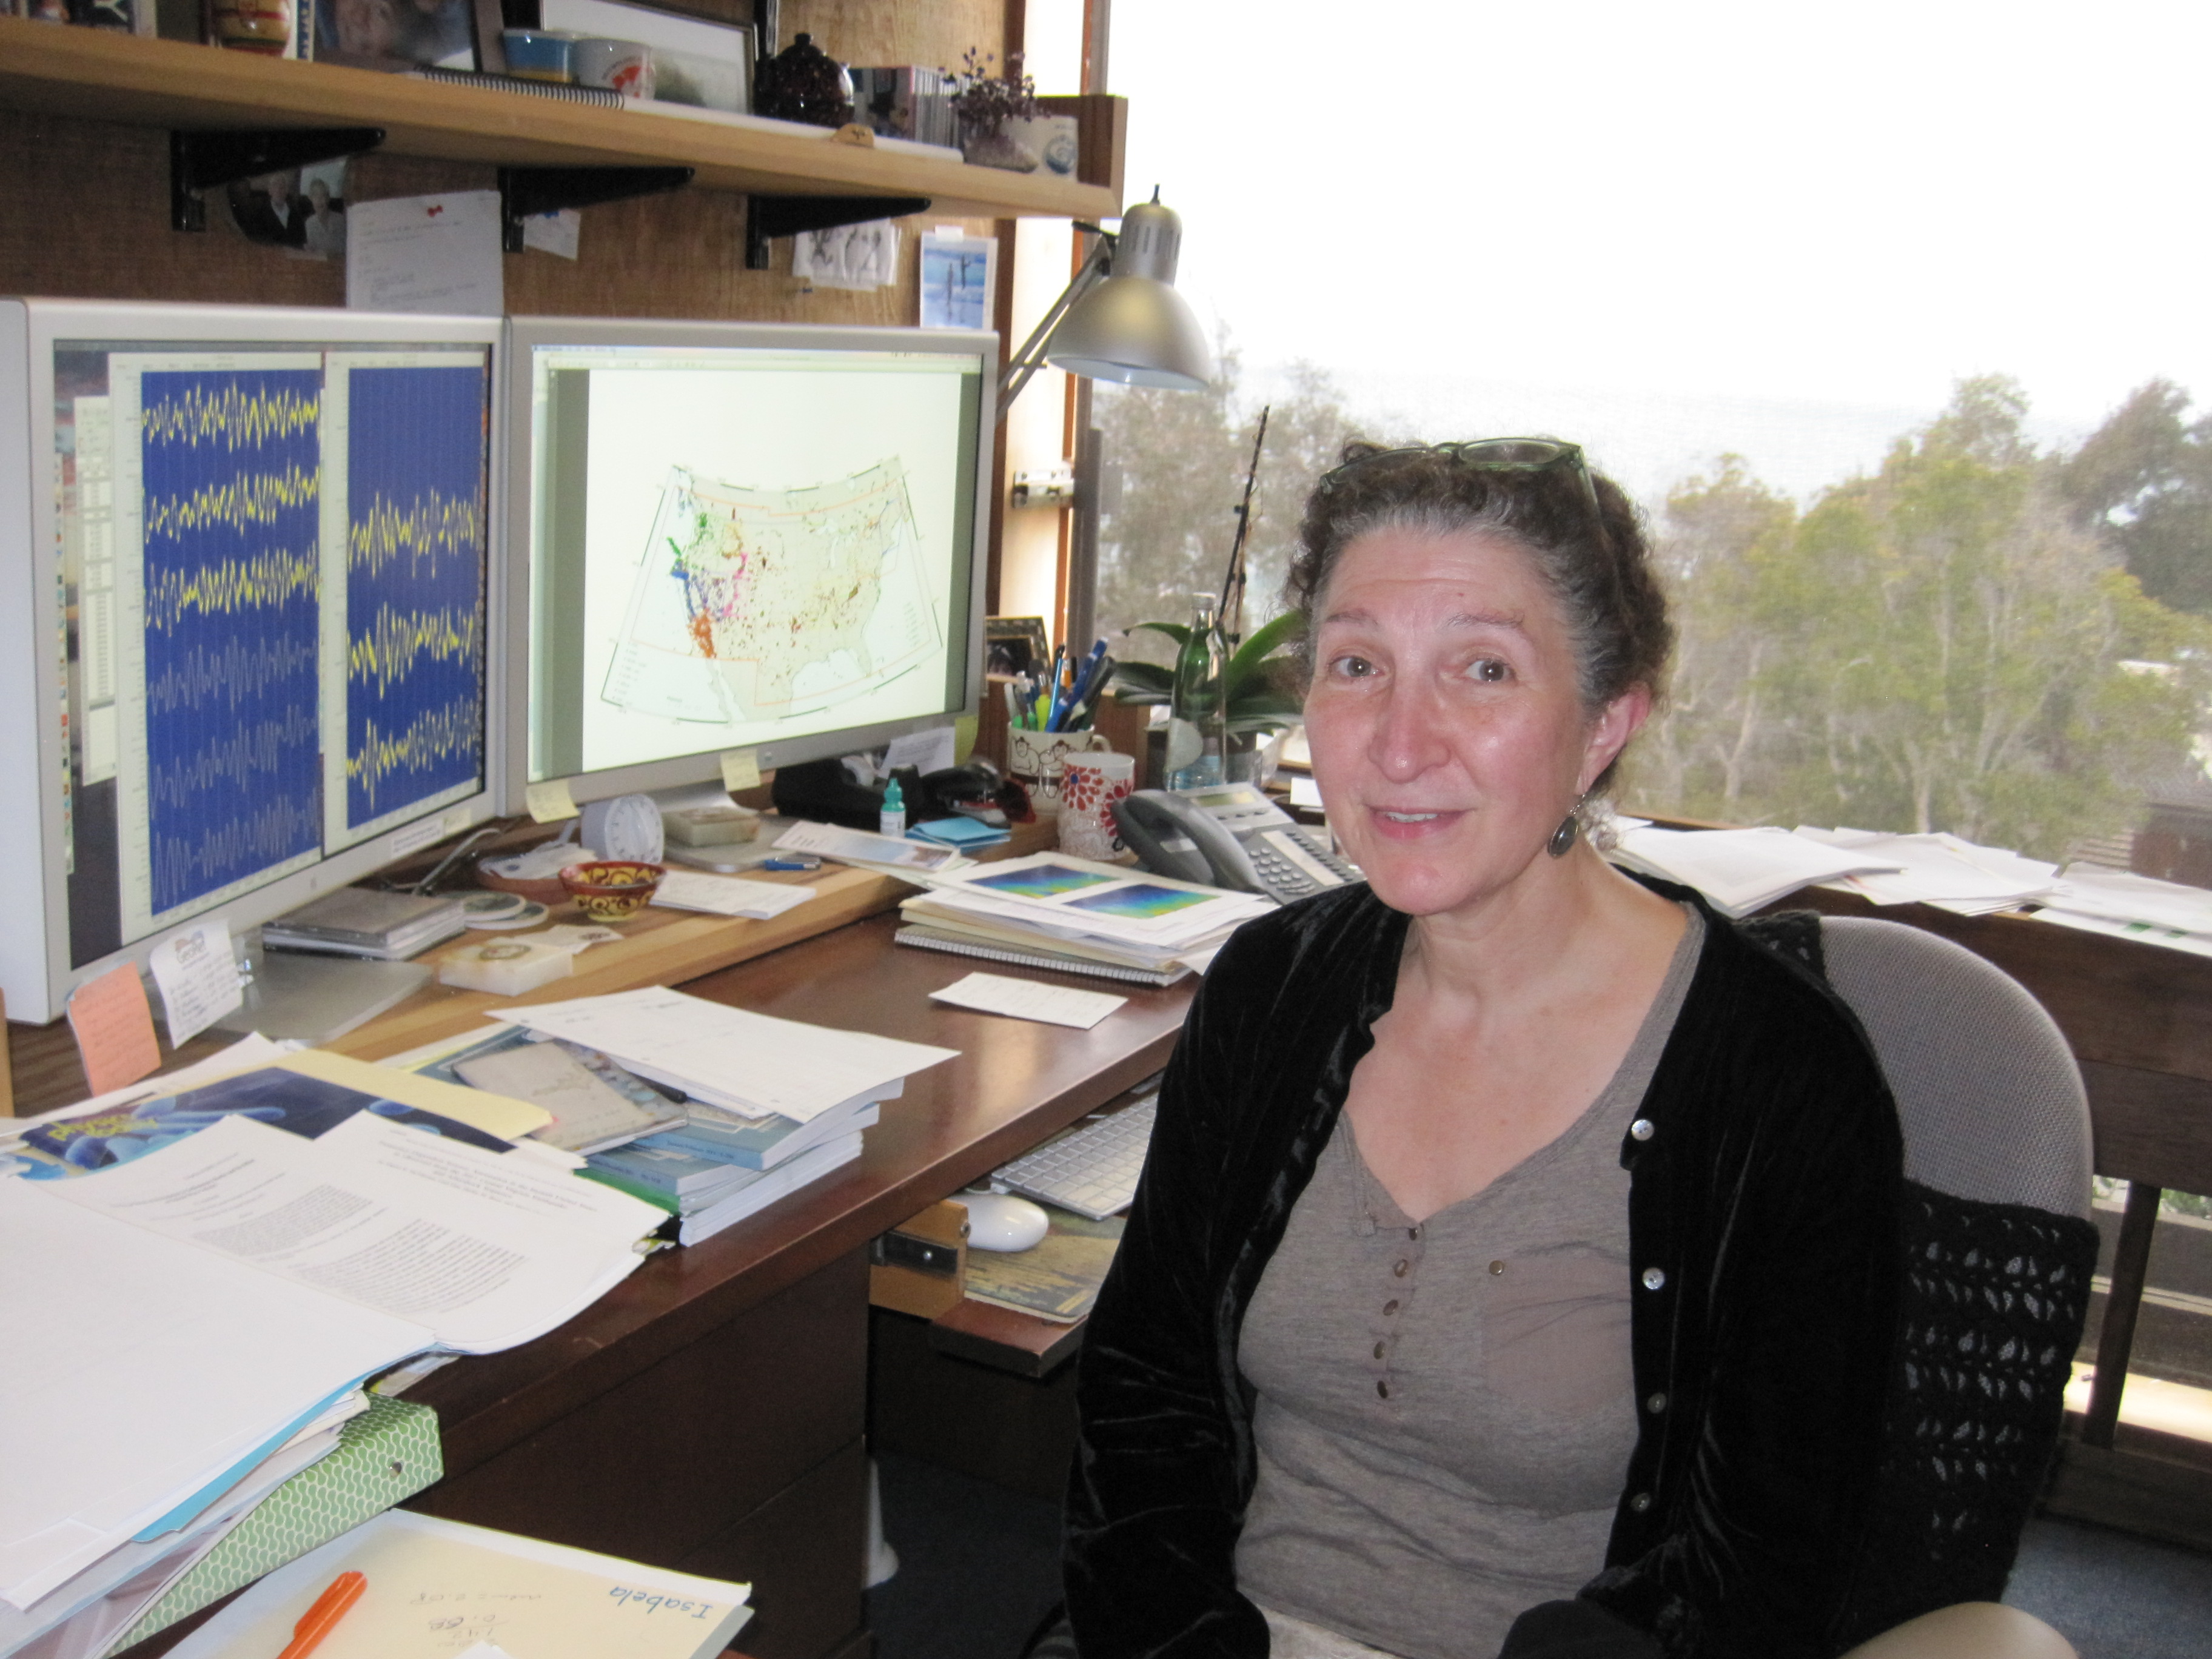
Luciana Astiz in her office at the Array Network Facility
earthquakes on a personal scale. She grew up in a tall apartment in Mexico City that magnified the shaking from distant quakes. Early one morning in 1979, when she was a teenager, a magnitude 7.6 earthquake jarred Astiz from her sleep. When her eyes snapped open, she saw her bedroom window yawning overhead, deformed by the tremors. Cracks were snaking up the walls. The city buildings, constructed of cement bricks and rebar, ruptured and whined as they warped. The power lines snapped and the high-tension wire buzzed and flailed as people ran screaming from the street. “It [was] kind of exciting and scary,” she says.
Nowadays, Astiz deals with earthquakes as waveforms on her computer screen in her book-lined office overlooking a popular surfing beach in La Jolla, California. Her watchful gaze is at the same time piercing and warm. She tells the story with theatrical sound effects and scrubs her hands together to demonstrate the violent frictions of tectonic plates catching at strike-slip faults and then jolting horizontally past each other.
Astiz has been captivated by seismology since that earthquake jolted her awake. “Everybody gets fascinated by astronomy, when you look at the stars,” she says. “I thought it would be like looking inside, like astronomy but inwards.”
Regional Differences
The TA put some of the more under-studied regions in the central and eastern United States under the microscope. As the TA deployment moved eastward from California, Astiz began to notice a strange trend. TA seismometers were registering 53% more events than other networks—not massive earthquakes, but tiny tremors less than magnitude 2.7 collectively known as microseismsicity.
“I thought, ‘Maybe these are just flukes, something not working right in the processing,’” says Astiz. When she and other ANF analysts probed further, however, they realized that the microseismic events spiked near the end of working hours and shared a characteristic waveform shape. Most of the microseismicity was located in the vicinity of underground coal mines in Kentucky, Virginia, and other areas of the Appalachians.
In fact, many of the microseismic events were actually mining blasts. Other regional networks in the United States tended to exclude the explosions from their bulletins because they knew where and when local companies mined. The ANF’s lack of bias proved to be a valuable asset because it allowed them to notice seismic patterns that regional networks often ignored.
“We also started seeing all this induced [i.e. human-generated] seismicity from gas exploration and all these events in Oklahoma,” says Astiz. Before 2006, Oklahoma had experienced about one magnitude 4.0 earthquake every century. After 2006, the TA registered magnitude 4.0 quakes nearly every two months. According to Astiz, “the ANF was the first one saying, “Hey, why are there so many earthquakes here?’”
They contacted the United States Geological Survey to share their findings. Using TA data, USGS researchers discovered the link between microseismicity and wastewater injected underground as a byproduct of gas extraction. “Right now it is pretty well accepted,” Astiz says, “that the injection of wastewater close to a fault is going to lubricate the fault and allow it to move.”1
The TA just happened to be deployed at the right time and in the right place to pick up on the surge in microseismicity. Astiz says, “It was totally fortuitous that gas exploration started to increase in 2005 and the USArray started around that same time.”
Earth Aboveground
Observations from the TA have prompted researchers to raise their gazes from the ground and look to the atmosphere.
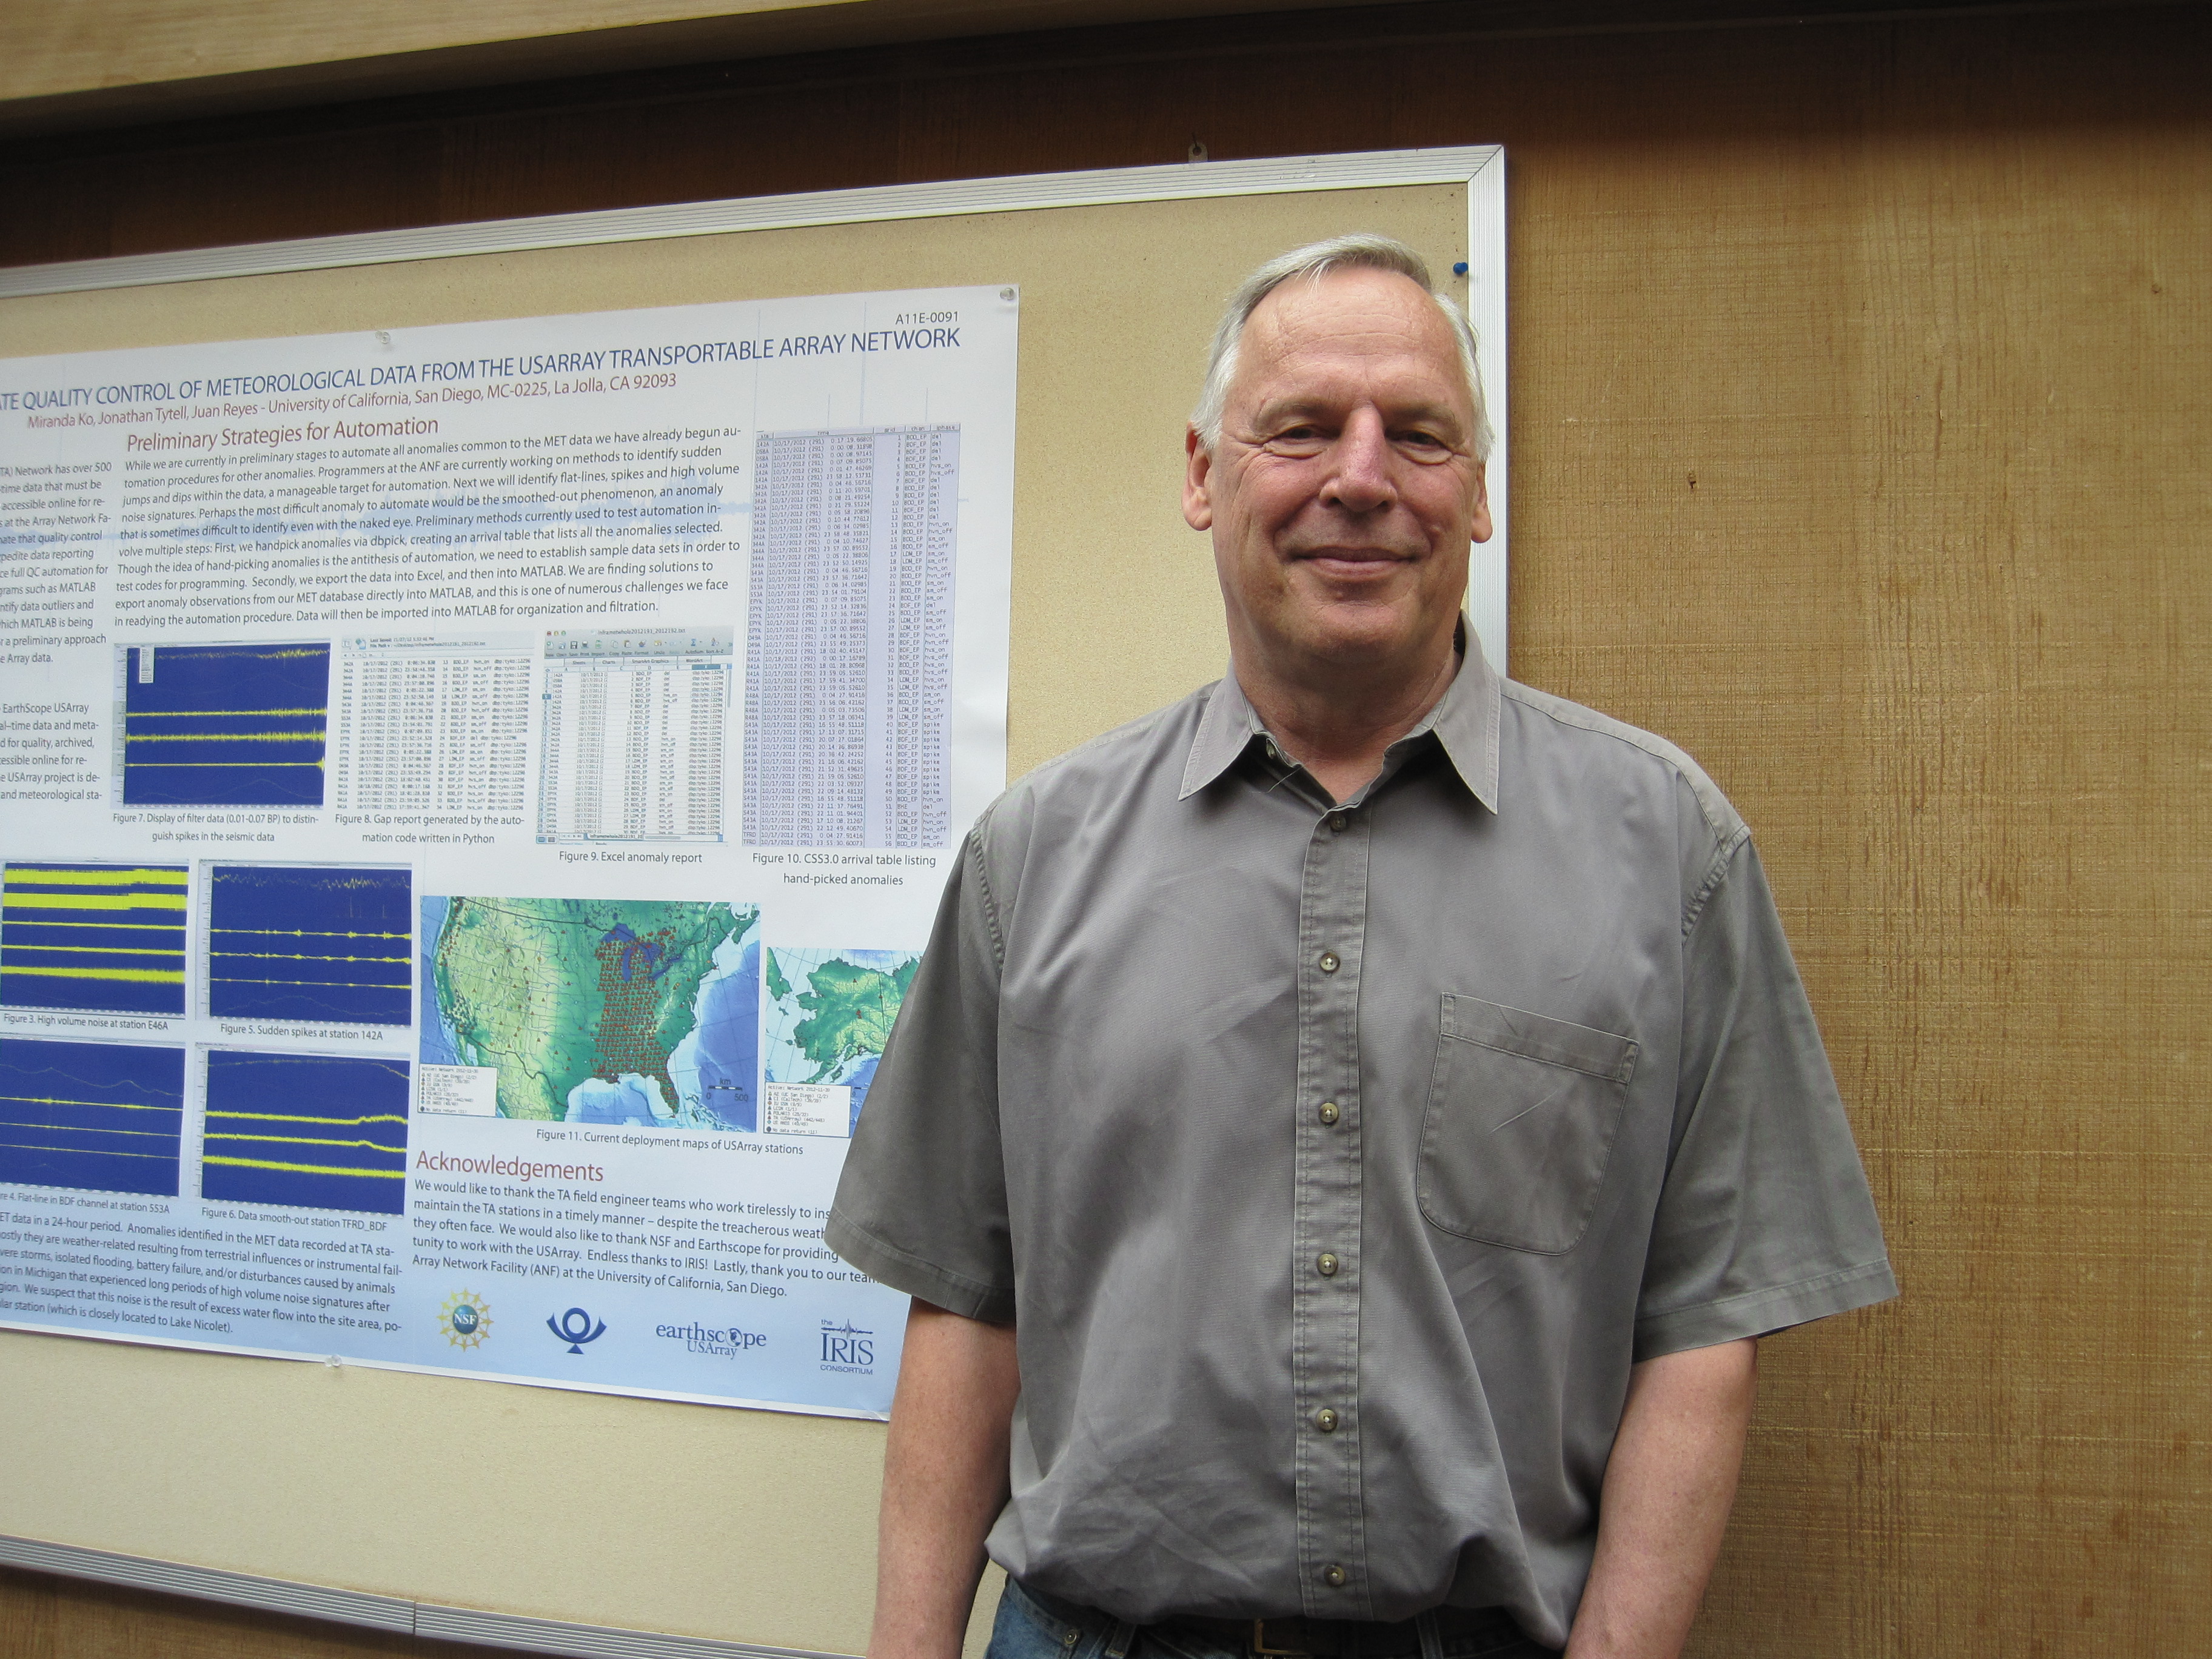
Frank Vernon outside his office
In 2010, some peculiar noise characteristics showed up on a subset of TA stations. Astiz’s supervisor, ANF director Frank Vernon, recognized that the signals could not be an earthquake; the propagation speed of the waves made no sense. Upon closer inspection, the signals formed a systematic pattern that correlated with large storm fronts sweeping across the Midwest. It turned out that TA’s seismometers, which were intended to record seismic waves from earthquakes, could register sound waves generated in the atmosphere. “We started looking in more and more detail and started getting more and more interesting signals,” says Vernon. “You could see how the ground actually got deflected as these big storms came across.”
Vernon realized the potential for the TA to benefit other fields outside seismology. The following year, he was awarded a grant to add pressure sensors to every TA station. As a result, the TA can now record infrasound, or low-frequency sound waves, from large storms reverberating off the troposphere and Earth’s surface.
Vernon also hired one of his old students, Jon Tytell, to process TA’s meteorological data. “If there’s a thunderstorm, we can see a slight tilt in the crust,” explains Tytell. “There was a tornado that went over the ground about a kilometer away from one of our stations. The seismic reading shows that the ground actually tilted to the northwest toward the tornado for just over a minute and a half.”
“When you make a really high-quality data set with really good measurements, there are lots of things you don’t expect to see,” says Vernon. “They start appearing and that generates new science.”
TA’s Telescopic View
One of the biggest challenges of running a seismic array is to suppress the natural noises that seismometers record in order to improve the quality of the earthquake signal. But what if seismologists re-framed their concept of “noise”?
Seismic noise is the continuous vibration caused by waves, water, human activity, and natural motion that make the heartbeat of the planet. On a seismogram, seismic noise looks like perpetual fuzz instead of a sharp amplitude jump. For a long time, seismic noise was considered unimportant and impossible to analyze. In the 1950s, however, scientists began to realize that what seemed like pesky artifacts mucking up seismic recordings could actually be data. But debate surrounds how to interpret them.
A geophysicist at the University of Colorado at Boulder named Michael Ritzwoller has figured out a way to use seismic noise recorded by the TA. He calls this method ambient noise tomography (ANT). Seismologists usually map the structure of Earth’s interior by analyzing how seismic waves ripple out from earthquakes. ANT, however, involves extracting information from the different frequency bands that make up the “Earth hum.” The key to ANT is zooming out to look at broad patterns. Instead of focusing on single events, ANT smoothes out the varied content of seismic noise by looking at extremely long time scales—more than a year’s worth of data—and vast areas, made possible by TA’s continental footprint.
Astiz thinks the TA is the ideal instrument to probe the nature of seismic noise: “The grid geometry and relatively small inter-station spacing of the array facilitate tracking seismic noise across the array and hopefully makes it easier to identify some of this ‘noise’ as being generated by a particular source.”
Right now Astiz is collaborating with ANF analyst Vladik Martynov to figure out how the moon and sun might affect seismic noise. She and Martynov have observed that high-frequency seismic noise recorded from a small network of seismometers in the desert of Southern California correlates with tides pulled by the moon and sun during Earth’s daily rotation. Their next step will be to search TA’s data set for the same tide-related seismic noise. “Pretty neat,” she says with a grin.
With a continent-sized instrument like the TA, Astiz and her colleagues at the ANF have their hands full keeping it tuned up and well calibrated so that scientists from other institutions can access standardized, high-quality information. “We support them by giving them data,” she says.
It takes an entire scientific community to explore the potential of a tool like the TA. Researchers and analysts from around the world bring their own perspectives to a data set that provides both close-ups and wide angles. As for Astiz, she has “a bird’s eye view.”
For more information, visit:
http://www.usgs.gov/faq/?q=taxonomy/term/9833
http://geology.gsapubs.org/content/41/6/699.short
http://www.sciencemag.org/content/341/6142/1225942.short
http://ciei.colorado.edu/pubs/2008/Yang_WUSA_phase.pdf
1 Wastewater injection from gas exploration is not the only culprit that can induce seismicity. When humans dam up water in canyons, the strain of such huge volumes of water can alter the stress field of a fault.

