

TUL1
Leonard, OK, USA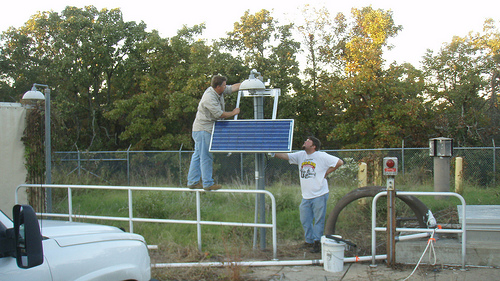
The USArray component of the NSF-funded EarthScope project ended its observational period in September 2021 and all remaining close-out tasks concluded in March 2022. Hundreds of seismic stations were transferred to other operators and continue to collect scientific observations. This USArray.org website is now in an archival state and will no longer be updated. To learn more about this project and the science it continues to enable, please view publications here: http://usarray.org/researchers/pubs and citations of the Transportable Array network DOI 10.7914/SN/TA.
To further advance geophysics support for the geophysics community, UNAVCO and IRIS are merging. The merged organization will be called EarthScope Consortium. As our science becomes more convergent, there is benefit to examining how we can support research and education as a single organization to conduct and advance cutting-edge geophysics. See our Joining Forces website for more information. The site earthscope.org will soon host the new EarthScope Consortium website.

Very early in the morning on August 6, 2007, ten men were mining coal in Crandall Canyon Mine in Utah. Suddenly, the roof collapsed. The imploding earth released so much energy that one of the miners who escaped said that the air rushing past him in the tunnel almost pushed over his pickup truck. He only escaped because he was a quarter-mile closer to the surface than the six miners that were buried under the crumpled mine.
Soon after, the news media flocked to central Utah to report on the mine disaster. The owner of the mine emphatically maintained that an earthquake caused the collapse. His claim might have remained uncontested, but that day hundreds of USArray seismometers were recording ground motion in the western US. They registered seismic waves at the time of the collapse from a sudden underground movement where the mine was located. A sudden mine collapse can release the same amount of energy as a magnitude 3.9 earthquake, so an earthquake or the collapse of the mine itself could have generated the recorded seismic waves. Within three days of the collapse, seismologists became forensic investigators in the case. Investigating objective measurements of the natural world, they had to decide what produced the seismic waves: earthquake or collapse.
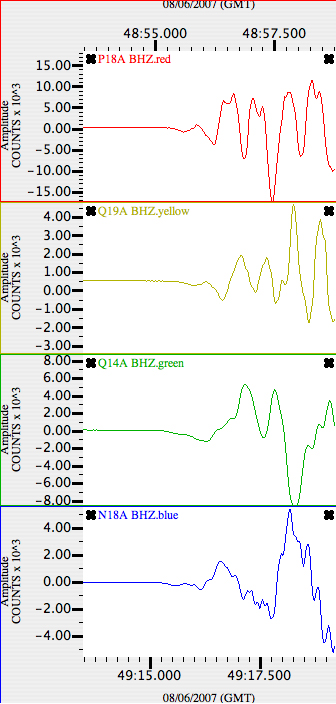
The clues in this case are the character and pattern of the recorded seismograms each a record of the ground movement at one of the seismometers in the region. The first bit of evidence on the seismograms that the seismologists investigated is the direction of the first P waves whether they start as a crest or a trough.
When the ground shifts abruptly as it does during an earthquake, energy in the form of seismic waves radiates in all directions. The P waves curve through the Earth's interior up to the surface, pushing and pulling the ground from beneath the seismometer. A P wave that lifts the ground corresponds to a crest on the seismogram; a P wave that sucks the ground inward corresponds to a trough. Seismologists can examine the first motion of the P waves to reconstruct the initial forces that triggered the event.
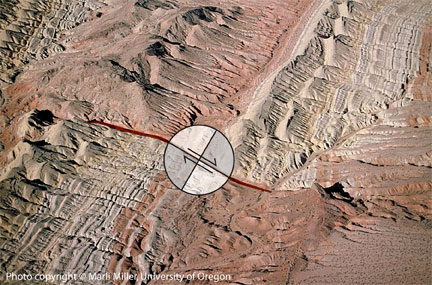 |
As an example, think about the San Andreas Fault. Imagine you're floating above it and you can see a desert-like landscape spread out underneath you. Painted on top is a huge circle divided evenly into four pieces. The northwest and southeast quadrants are black, and the other two quadrants are white. The line dividing west and east lines up perfectly with the fault. By coincidence, the fault begins to rupture in the center of the painted circle. You watch the Pacific Plate on the left side jolt northwards as the North American plate shifts southwards. As you are floating in the air looking directly down at what is both the center of the circle and the epicenter of the earthquake, you will see the northwest quadrant and the southeast quadrant move away from the epicenter. The southwest quadrant and the northeast quadrant move towards the epicenter.
 |
 |
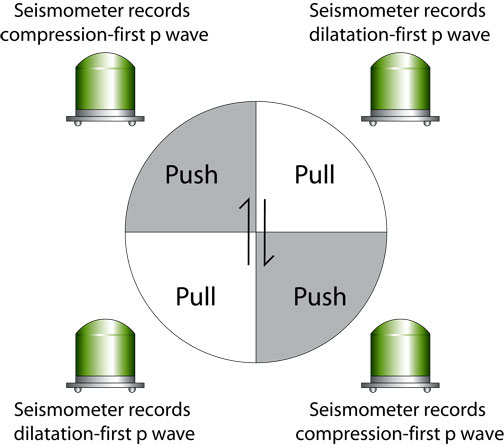
A black and white circle diagram is exactly what seismologists create to understand the orientation of the fault and the direction of slip after an earthquake. Black quadrants on the circle are moving away from the focus and white quadrants are moving towards the focus. Seismometers located in the black record a P wave that begins as a compression, or a push, and seismometers located in the white quadrants record a P wave that begins as a dilatation, or a pull.
Since seismologists can't float in the air and watch the earthquake as it happens, they examine P wave first motions recorded from many seismometers distributed around the focus to reconstruct quadrants of compression and tension on the circular diagram.
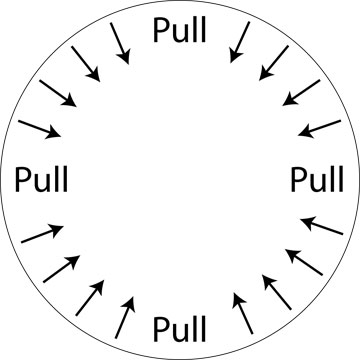
The first-motion diagram from the mine collapse is different. It does not show a four quadrant alternating black and white pattern like an earthquake across a fault would produce. The diagram is all white, indicating that all sixteen seismometers used in the analysis recorded a P wave that began as a dilatation. For the P wave to begin as a dilatation at every seismometer, the ground must have been stretched in all directions towards the focus of the seismic event. A collapse of an underground cavity could have caused this. Relative to the location of the seismometers on the surface, the implosion is initially pulling inward, stretching the rock above the roof of the cavity and causing dilatation-first P waves. An explosion, on the other hand, would push energy outwards in all directions, and its P waves would begin as compressions.
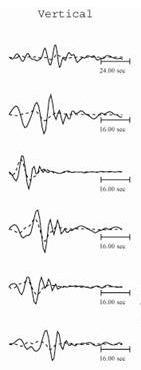
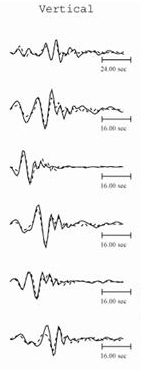
Before delivering a verdict in this case, the seismologists decided to examine more evidence. Instead of just looking at the first motions of the P waves, they investigated the entire record of ground motion. Reconstructing the initial forces that triggered the seismic event from the full record is tricky because they are faced with an inverse problem: they have the data (the seismograms), but now they need to fit the best mathematical model of ground motion to the data. From the model that fits best, they can tell what kind of seismic event produced the particular waveforms.
To solve the inverse problem, the seismologists first compared the seismograms from this event to seismograms from smaller earthquakes in the past to build a mathematical model for the forces and ground motion this event. They then used a computer program that tries many different models and reports how well each model fits the recorded seismograms. The best-fitting model indicated that an implosion took place. When the researchers tried to force a model that indicate forces characteristic of a fault slipping, the model fit the data poorly.
 |
 |
 |
From the full analysis of the seismograms, seismologists concluded in this case that an earthquake did not cause the seismic event, but rather the mine collapse produced the seismograms. The seismologists let the seismograms decide an either-or hypothesis -- either an earthquake caused the collapse or it didn't, but in this case seismologists cannot speculate on whether mining practices weakened the roof supports where people worked underground everyday. However, a Congressional investigation completed in May 2008 found that staff at the Crandall Canyon Mine hid information from federal mining officials that could have prevented the disaster, the mining company should never have requested to remove coal from the section of the mine where the collapse occurred, and federal mining officials should not have approved the request.
The data seismologists used to investigate the Utah mine collapse came from the USArray project. USArray is one component of the most ambitious earth science project ever conducted in the United States, the EarthScope project. EarthScope is a decade-long experiment to understand the formation and structure of the North American continent and the processes that control earthquakes and volcanoes. Right now in the western US, engineers are deploying seismometers on public and private lands in a dense grid with 70 km spacing. The 400 transportable seismometers will leapfrog across the country, completing the trip east in the year 2013. From the tremendous amount of data collected, earth scientists will be able to solve some outstanding mysteries of the Earth's interior.

